🏖️ Bolivar Peninsula Market Report – Mid-Year 2025 Snapshot
As we hit the halfway mark of 2025, the Bolivar Peninsula real estate market continues to evolve. The trends so far this year point to a cooling market with slower sales, rising inventory, and more negotiation room for buyers. While 2023 and 2024 reflect full-year data, we now have a solid mid-year picture of where 2025 is headed—and how it compares.
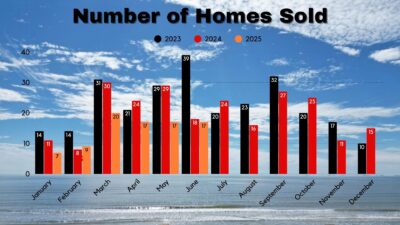
📉 Number of Homes Sold: Down Significantly
In July 2025, only 90 homes have sold year-to-date, compared to 237 for all of 2024 and 278 for all of 2023. While we still have six months to go, it’s clear that 2025 is pacing behind. March through July especially show a drop in monthly closings compared to previous years. Buyer activity has cooled, and homes are staying on the market longer.
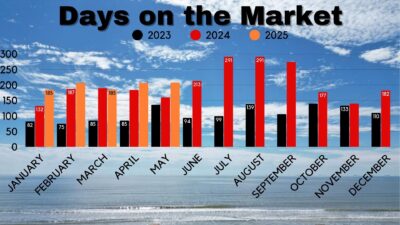
⏳ Days on Market: Doubling the Wait
Homes are taking much longer to sell. July 2025’s average DOM is 291 days, a sharp increase from 106 DOM in July 2024 and 99 DOM in July 2023. The year-to-date trend suggests sellers need to be patient—and realistic. Pricing, presentation, and condition matter more than ever.
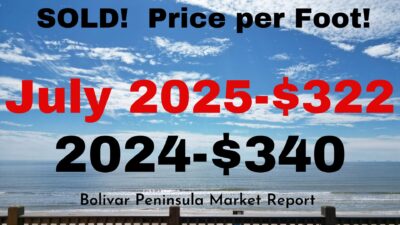
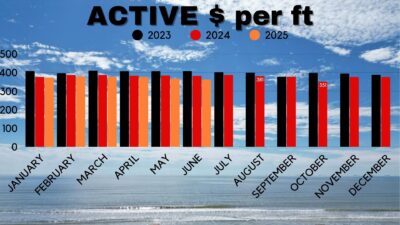
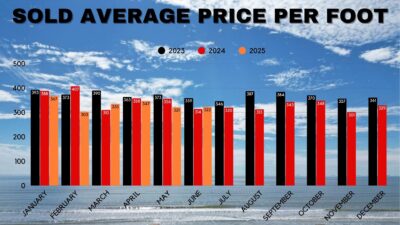
💲 Price Per Square Foot: Softening But Holding Ground
In July 2025, the average sold price per square foot was $322, down from $340 in July 2024. Although this reflects a downward shift, it’s a relatively gentle correction when compared to steeper national declines. Buyers still value location, especially beachfront, but they are clearly becoming more selective.
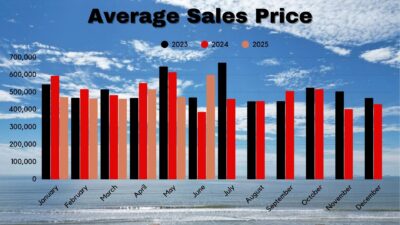
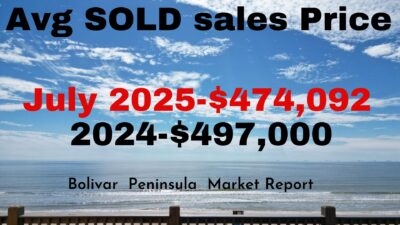
🏡 Average Sales Price: Gradual Decline
The average sold price in July 2025 is $474,092, compared to $497,000 in July 2024. This 5% year-over-year dip isn’t dramatic, but it reinforces the larger trend: prices are cooling in response to higher supply and lower urgency.
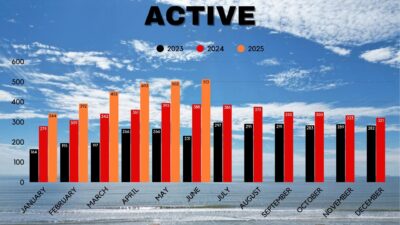
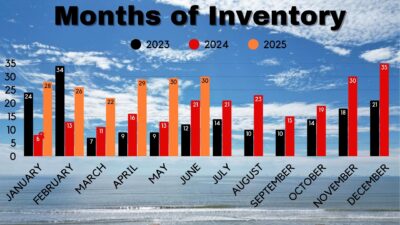
📦 Inventory: High and Still Climbing
The number of active listings continues to rise. July 2025 hit 513 active homes, compared to 388 in July 2024 and 297 in July 2023. That’s an increase of over 70% in just two years. With more homes available and fewer buyers in motion, it’s becoming a buyer’s market on the peninsula.
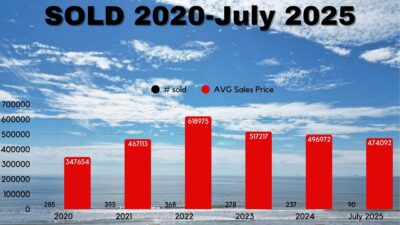
🧭 Market Snapshot: 2020–Mid 2025
From the peak average sale price of $618,975 in 2022 to $474,092 by July 2025, we’ve seen a gradual and healthy market correction. Total sales volume is also down sharply: only 90 homes sold so far in 2025, on track for the lowest full-year total in the past five years.
| Year | Total Homes Sold | Avg Sales Price |
|---|---|---|
| 2020 | 285 | $347,654 |
| 2021 | 395 | $467,113 |
| 2022 | 368 | $618,975 |
| 2023 | 278 | $517,217 |
| 2024 | 237 | $496,972 |
| 2025 (YTD) | 90 | $474,092 |
🧠 What It All Means
For Sellers:
The days of instant offers are behind us. Inventory is high and buyers are moving cautiously. Homes that are priced right and well-presented are still moving, but flexibility is key. Expect longer time on market, more negotiations, and the need to stand out.
For Buyers:
There’s opportunity. More listings and motivated sellers mean this is the best time in years to make a deal on a coastal property. If you’ve been waiting for leverage—this is it.
For Investors:
Rental potential remains, but returns need to be carefully calculated. With fewer sales and longer DOM, holding power and a strong strategy are essential.
✨ Final Thought from Beth
We’re not in a crash—we’re in a correction. The Bolivar Peninsula remains one of the most desirable coastal destinations in Texas, and the long-term outlook remains positive. But in today’s market, it takes expert strategy, real pricing insight, and hyper-local marketing to sell. And that’s where I come in.
Let’s talk about how to position your property—or find your perfect coastal retreat—before the tides shift again.
—
Beth Terminella
One10 Realty Group | Brokered by eXp Realty
📞 214-801-9801
🌐 WeSellCrystalBeach.com